StatGrapher User Interface
Windows and Tabs
|
|
|
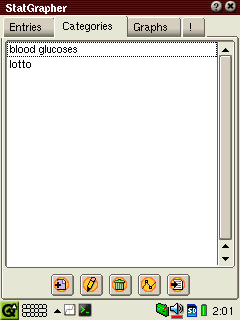
| The Categories tab, first logical tab to use, though less visited than Entries, and more visited than graphs. The icons at the bottom allow our user to perform these tasks: Add new category (brings up a dialog), Edit a category (brings up a dialog), Delete a category (brings up a confirmation), Graph a category (brings up a dialog), Export a category (brings up a dialog). Only one category may be selected at a time from this list. The list is displayed alphabetically. |
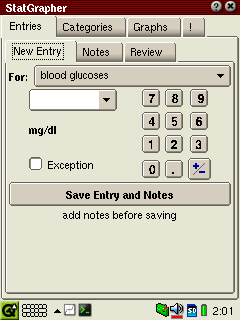
The Entries tab will be the most common one accessed. Inside it the first sub-tab is New Entry. The process works as follows: Select a category from the drop-down list (sorted alphabetically, defaults to last one used). Use the number/decimal buttons to tap in a numeric value into the units box. Change the units from + (above zero) to - (below zero) with the +/- button. Choose from the last 10 entered units with the combo function. If the entry is an 'exception' the checkbox can be tapped. Exception is simply a flag in the database to help categorize data. Before hitting 'Save' the user may want to enter Notes for this entry. |
|
|
|
|
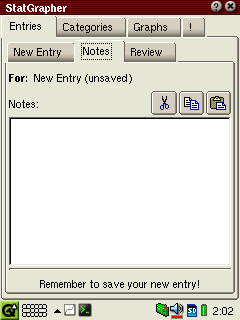
The Notes panel serves a double purpose. For new entries, the Notes will initially be empty, and allows the user to specify notes for this as-yet-unsaved entry. the cut/copy/paste icons serve their normal function. The entry has to be saved from the 'New Entry' tab. When reviewing previous entries, the Notes panel displays notes associated with the selected entry from that panel. Notes being displayed may NOT be edited at that time. |
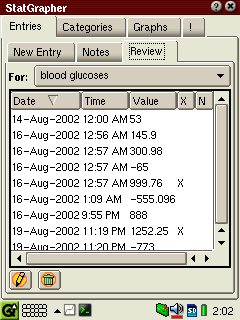
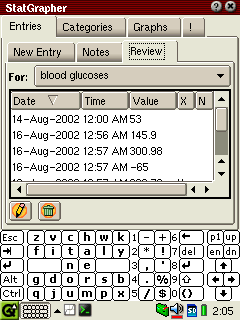
The Review panel allows selection of a category, then displays all entries (initially in date/time order) for that category. The 'X' column indicates if the entry is an exception. the 'N' column indicates if there are notes for this entry. Columns may be re-sorted by tapping their headers. The selected entry may be edited (brings up a dialog) or deleted (brings up a confirmation). |
|
|
|
|
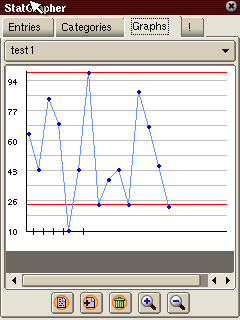
The Graphs tab displays a graph initially when the user selects the graph option from the Categories tab. Graphs are created in a way such that they make use of all available height for the graph widget, but may be significantly longer than available width. The scroll bar allows the user to scroll/pan left and right through the graphed data. Selecting a graph style automatically loads its parameters, loads the data, and graphs it. The list is sorted alphabetically. The first icon displays a dialog containing any notes that are part of a previously saved graph. A graph's parameters may be saved to the drop-down list that appears at the top of the panel by tapping the second icon. Tapping the trash icon will delete (with confirmation) the selected saved graph style. The (+) and (-) icons allow for zooming in and out of the data, which is redrawn at a new horizontal scale each time in the range -4, -2, 1, 2, 4.
|
This is just an example of how the application automatically resizes itself according to the available space on-screen. In this illustration, the virtual keyboard has caused the Review Entries panel to shrink, but no functionality is lost. |
Dialogs
 |
|
|
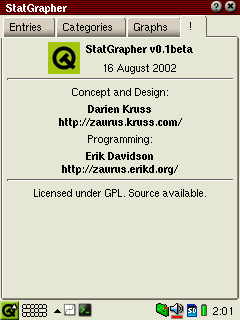
| about_dialog.ui The ubiquotous about box. Need I say any more? (We'll have to keep the version number and date current on here with each release. Also, must check on wording for GPL license.) |
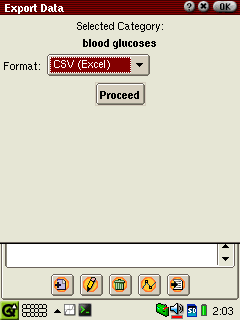
export_dialog.ui Called as step #1 when the Export icon is chosen from the Category tab. Shows the selected category name, allows user to specify an export format. |
|
 |
 |
|
range_dialog.ui This dialog will serve several purposes. It will appear as step #2 when called from the Export icon to narrow the amount of data written to a file. It will also appear as step #1 when the Graph icon is tapped from the Categories tab to determine what data should be graphed. (I would like the date fields to be replaced with pop-up calendars. I can show an example. I would also like the 'end' date and time to have an option for 'now' so a saved graph can be from a specified start date to 'now'.) The Show dropdown contains 'all', 'normal only' and 'exception only' options. |
min_max_dialog.ui This dialog appears as step #3 when called from the Export icon, again to further narrow the data written. Proceed then brings up a 'file save' dialog which I hope is already a widget. It is also called as step #2 from the Graph icon. |
|
 |
|
|
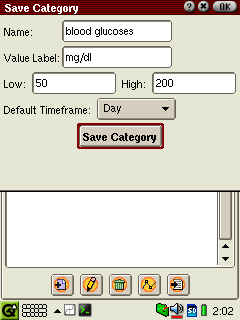
category_dialog.ui This dialog is used to create a new category from the Add icon in the Category tab. First two fields are required, last three are optional. (Perhaps I'll put them into a visual group with a box to make that more clear.) Default Timeframe contains items such as: hour, workday, day, week, month, quarter, year. This is only used in graphing to draw vertical lines at the indicated time spans. |
save_graph_dialog.ui This dialog appears on the Graph tab when the Add icon is tapped. It allows the user to save the currently-displayed graph settings so that they can be recalled at a future time. The View scale should probably be pre-populated with the currently-used scale, as well as some common values such as -4, -2, 1, 2, 4. |
|
|
|
|
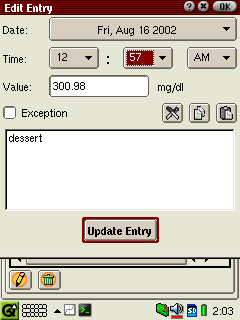
entries_edit.ui This dialog is used to edit an existing entry. We are using the calendar-type date selector here, and combo boxes for the hour, minute, and meridian. Existing values are shown where appropriate. |
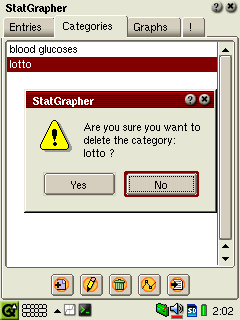
categories_delete This dialog appears to confirm that you really want to delete an entire category. |
|
|
||
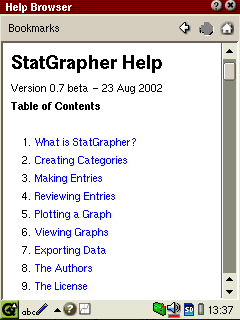
| The help file will display when the '?' is clicked in the titlebar. |